Oulu’s nitric oxide levels in 2025 were the lowest ever recorded
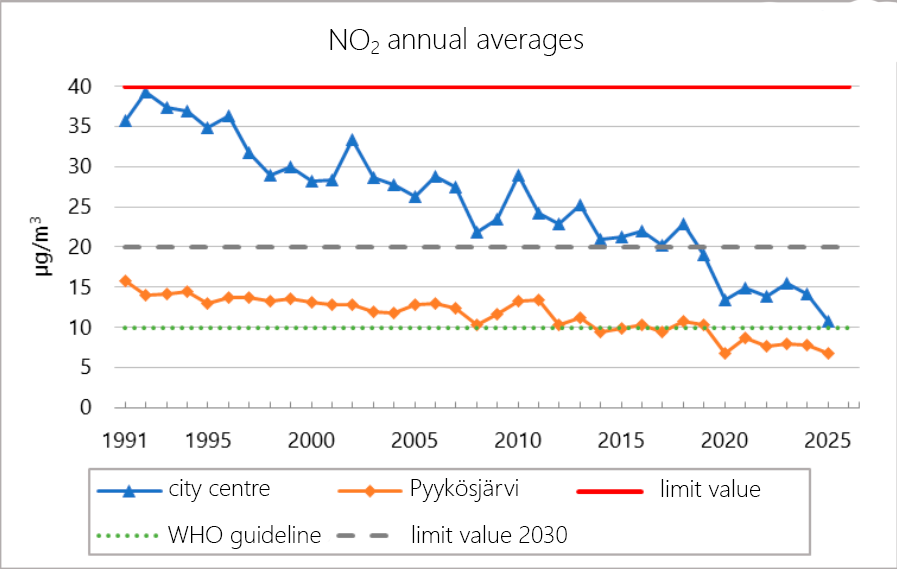
Nitric oxide concentration levels in the Oulu city centre were the lowest ever recorded in 2025. Nitric oxide originates primarily in traffic exhaust fumes. The largest factor in lowering the levels is presumably the electrification of public transportation; 49 % of Oulu Regional Transport (OSL) buses are electric.
The development of nitric oxide’s annual averages in the 2020s is clearly showing a downward trend. In Pyykösjärvi, the situation has been great for a long time already as the World Health Organization WHO’s guideline level has been achieved since 2020. In the Oulu city centre, WHO’s guideline level was still exceeded 2025, but only by very little.
In 2025, WHO’s daily guideline level was exceeded 12 times in the Oulu city centre, and 4 times in Pyykösjärvi. The levels are exceeded often on cold days since motors produce more emissions when running cold. No limit value has been set for daily levels. For hourly levels, results in both areas go under the limit value and WHO’s guideline level.
WHO’s guideline levels are recommended global concentration levels based on minimizing health risks. When air pollution stays under the guideline levels, there will be no harmful health effects or they will be very minor.
Air quality was primarily good in 2025
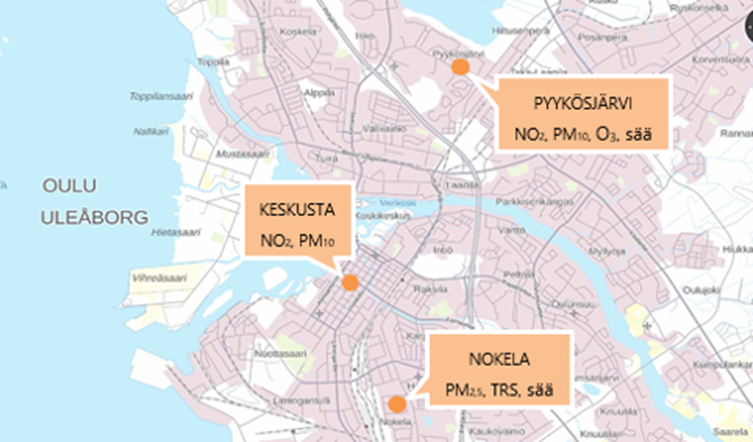
In 2025, the air quality in Oulu was mostly good. Air quality is measured in Oulu at three fixed measurement stations. The station in the city centre represents air quality in a busy traffic environment. The station in Pyykösjärvi represents air quality in a residential neighborhood outside of the city centre. The station in Nokela measures the air pollution of the Nuottasaari Industrial Park. The measured variables are nitric oxide (NO2), respirable particles (PM10), fine particles (PM2,5), ozone (O3), and odorous sulfur compounds (TRS).
Air quality was graded as good or acceptable in the city centre for 97% (84% good, 13% acceptable) and in Pyykösjärvi for 99% (92% good, 7% acceptable) out of the entire year’s hours. Bad or very bad air quality measurements came about mainly due to road dust. There was a total of 36 hours of bad or very bad air quality in the city centre and 4 hours in Pyykösjärvi.
The current weather situation affects the spread and appearance of air impurities. Weather can have either a weakening or cleansing effect on air quality. For example, rain and fog clouds cleanse the air. Also, when winds are weak, traffic emissions do not mix and gather near their sources. In 2025, January–March was clearly milder than average. In July, the temperature was higher than average. Also, fall was warmer than usual. In the fall, we had to wait for the winter and snow. In November–December, the snow levels fluctuated, it snowed but the snow either melted or froze. The weather was very slippery.
Respirable particle concentrations are at the same level as previous years
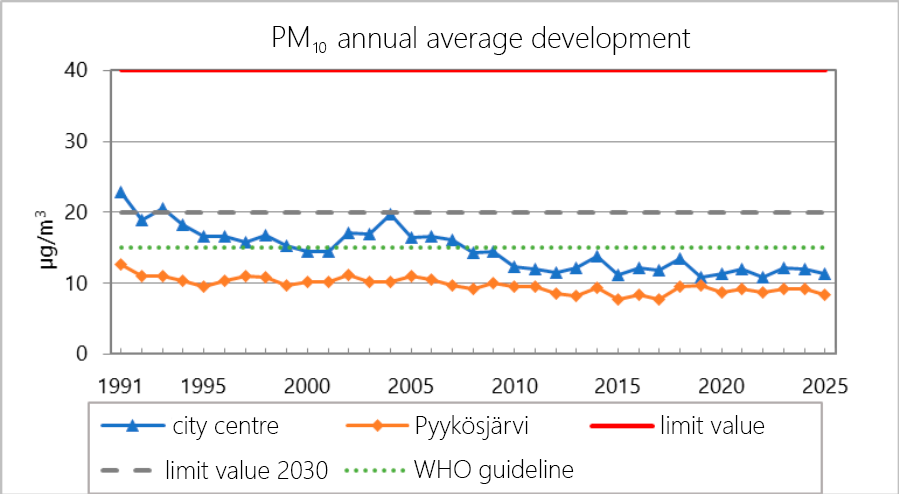
The first high road dust concentrations were measured in the city centre already in March. The road dust season took place in March–May. High road dust concentrations were not measured in Pyykösjärvi during road dust season. In the city centre, the concentrations of respirable particles were slightly higher than in Pyykösjärvi during the entire year. Concentrations of respirable particles also rose in December when slippery weather demanded gritting which weakened air quality.
In the city centre and Pyykösjärvi, annual averages were similar to last year. The annual averages were below the limit value and WHO’s intensive guideline levels. There were five (5) days when the daily levels were exceeded in the city centre. In Pyykösjärvi, the levels were not exceeded at all. The daily level may be exceeded 35 times during one year.
Ozone concentration’s flexible 8-hour average was very close to WHO’s guideline level
In 2025, the highest flexible 8-hour average of ozone concentration was very close to WHO’s guideline level 100 µg/m3 as the level was 101,6 µg/m3. Ozone’s long-term limit value 120 µg/m3 was not exceeded at all. Ozone’s long-term limit value was exceeded in 2014, 2019, 2023, and 2024.
Ozone is not an emission but is formed in reactions between sunlight, oxygen, nitrogen oxides, and hydrocarbon. Ozone’s background concentration is naturally extensive (for example, due to spreading from a higher atmosphere) and it is present in the air even when deprived of sunlight. Ozone also migrates to Finland from further central and southern Europe where conditions for its formation are more favorable.
Odorous sulfur compound concentrations are small
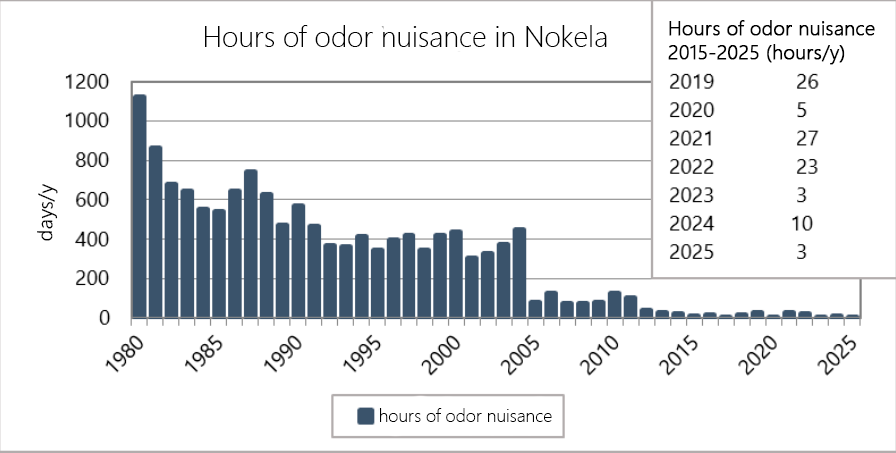
The concentrations of odorous sulfur compounds and hours of odor nuisance have been low according to measurements in 2025. There were only three hours of odor nuisance.
You can monitor the real-time air quality situation on the Finnish Meteorological Institute’s website ilmanlaatu.fi. You can also read more about air quality in the Oulu on the Environment Office of the Oulu Region’s webpage, ouka.fi/en/air-quality.
Oulu’s Air Quality Report compiles data on measured respirable and fine particle, nitrogen oxide, ozone, and odorous sulfur compound concentrations as well as information on industrial, energy production, and traffic emissions. Stora Enso Oulu Oyj, Oulun Energia Oy, Environment Office of the Oulu Region, Oulun Satama Oy, Kiertokaari Oy, Adven Oy, Fermion Oy, Kemira Chemicals Oy, Kraton Chemical Oy, and Peab Industri Oy were responsible for the monitoring costs. Aeri Oy was responsible for the implementation of the measurement operations. The Environment Office of the Oulu Region was responsible for the evaluation report’s compilation.
Oulu’s Air Quality Report for 2025: Oulu’s Air Quality Report 2025 (in Finnish)